|
Continuing our work on data handling, this week we conducted our own surveys. We worked through the 4 steps of: - Collecting Data - Recording Data - Organising Data - Interpreting Data Before we began to collect data, we thought about what we would like to find out about our fellow grade 3 peers. Some of us wanted to find out what our favourite books are, our favourite video games, our favourite pets and our favourite colours. Once we had an idea about what we wanted to find out, we learnt about effective questioning. We had to make sure that the question we asked would give us the data we wanted to find out about. We collected our data in ways that suited us individually. Some collected in lists, tables and tallies. Once we had done that, we transferred our data onto cards so that they were easy to manipulate and sort. Categorising our data was the trickiest part as some of our data didn't fit into the categories we had made, some of us created categories that didn't represent our question and some of collected answers that we didn't recognise so we didn't know which categories to put the data into! After solving these small issues, we were able to create pictograms or bar charts to represent our data. Finally, we used phrases like the ones below to help us interpret our data. It was a long process - it took us the whole week! But we had a lot of fun carrying out this inquiry and now that we've been through the whole process we're getting better at handling data! 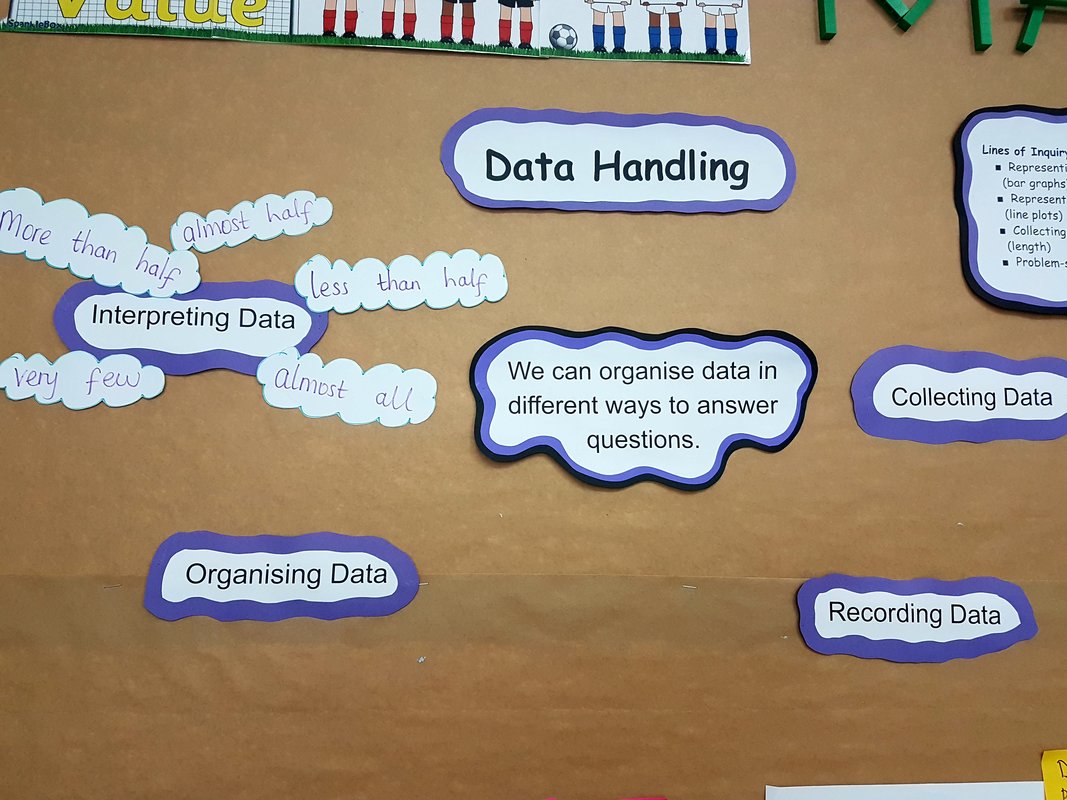
0 Comments
Leave a Reply. |
Hello!We are a group of 8 and 9 year olds who are kind, fun and imaginative! 
Archives
March 2018
|
 RSS Feed
